Nova SaaS Financial Platform

Nova SaaS Financial Platform

Nova SaaS Financial Platform

2023

2023

2023

Client: Nova Financial Firm

Project Duration: 3 Months

Client: Nova Financial Firm

Project Duration: 3 Months

Client: Nova Financial Firm

Project Duration: 3 Months

a Photo of nova SaaS Platform
Web Design
UX/UI Design
Figma
Framer

Project Overview

Nova is a financial firm seeking to implement a robust SaaS platform to enhance their financial management and analytics capabilities. The case study process outlines the main dashboard pages, analytics charts, and usability testing to ensure the platform meets Nova's needs.

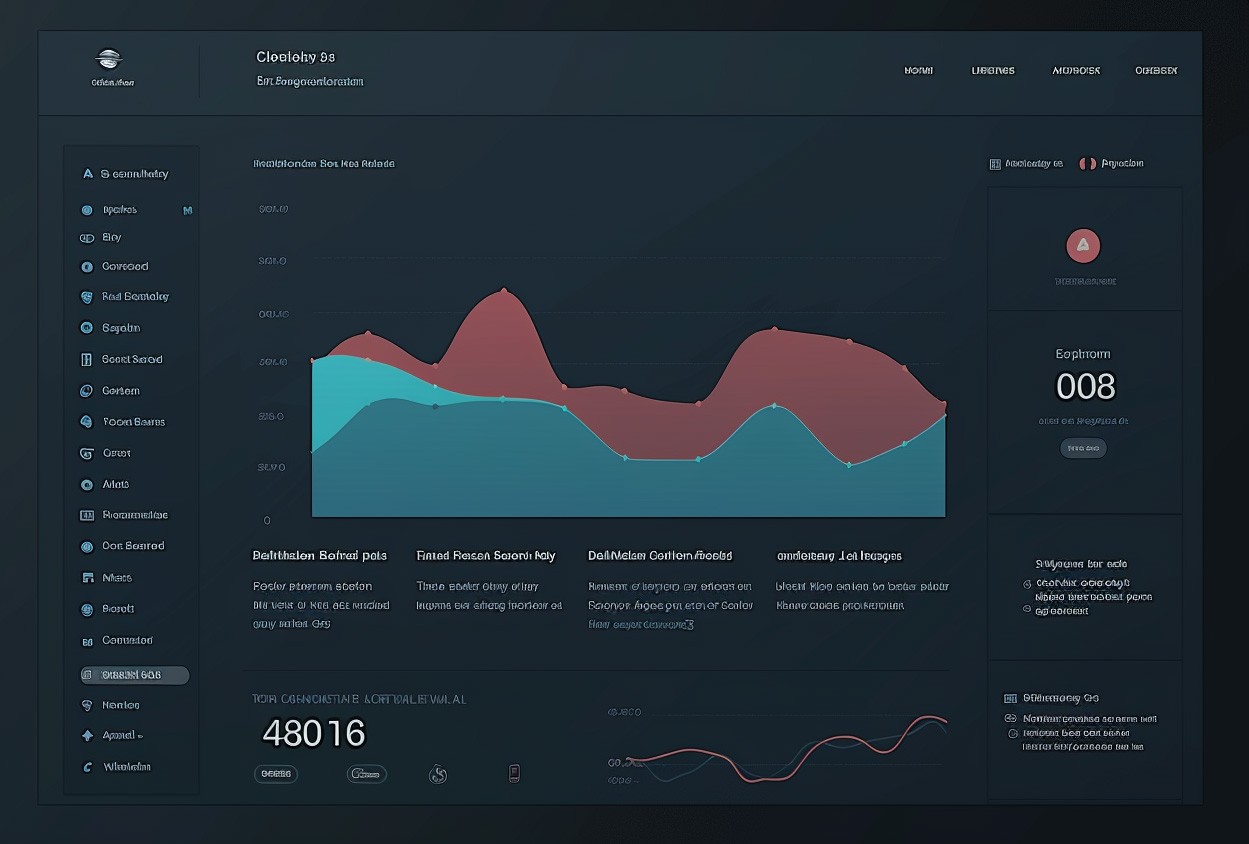
Main Dashboard Pages

  1. Home Dashboard

  2. Accounts Dashboard

  3. Analytics Reports

  4. Settings

a photo of a UI dashboard
a photo of a analytics charts

Analytics Charts

  1. Revenue Trends

    • Description: Line chart showing monthly revenue trends over the past year.

    • Purpose: Identify patterns and forecast future revenue.


  2. Expense Breakdown

    • Description: Pie chart illustrating the distribution of expenses across different categories.

    • Purpose: Understand major cost drivers and opportunities for cost reduction.


  3. Profit Margin Analysis

    • Description: Bar chart comparing profit margins across different time periods.

    • Purpose: Evaluate financial health and profitability.


  4. Cash Flow Projection

    • Description: Area chart predicting future cash flows based on historical data and trends.

    • Purpose: Plan for cash needs and avoid liquidity issues.

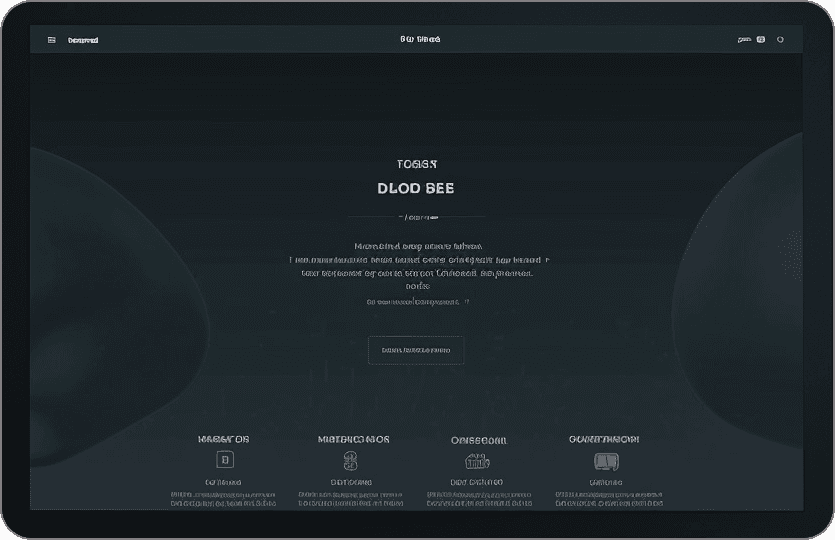
a photo of a Saas Platform
a photo of a Dashboard design

Usability Testing

  1. Scenario-Based Testing

    • Objective: Assess how real users perform specific tasks (e.g., generating a report, customizing the dashboard).

    • Method: Create realistic scenarios and observe user interactions.

    • Outcome: Identify usability issues and areas for improvement.


  2. A/B Testing

    • Objective: Compare different versions of the dashboard to determine which layout is more effective.

    • Method: Split users into groups and present different dashboard versions.

    • Outcome: Determine the most user-friendly and efficient design.


  3. Task Completion Rate

    • Objective: Measure the percentage of tasks users can complete successfully.

    • Method: Track task completion across various users and tasks.

    • Outcome: Gauge the platform's usability and identify bottlenecks.


  4. User Satisfaction Surveys

    • Objective: Collect feedback on user experience and satisfaction.

    • Method: Distribute surveys post-interaction to gather qualitative data.

    • Outcome: Gain insights into user preferences and satisfaction levels.

Conclusion

The case study process for Nova's Financial SaaS platform involves designing comprehensive dashboards, implementing insightful analytics charts, and conducting thorough usability testing. This approach ensures the platform is user-friendly, meets Nova's financial management needs, and provides valuable insights for informed decision-making.

Your Ideas Deserve Better.

Get In Touch!

All Rights Reserved © Copyright Sepid Design 2024

All Rights Reserved © Copyright Sepid Design 2024

All Rights Reserved © Copyright Sepid Design 2024